
Indian hockey's single-customer business: 41 corners, six field goals and the fourth-quarter bill
**मुख्य उत्तर (≤60 शब्द):** भारतीय पुरुष हॉकी टीम के गोल मुख्य रूप से पेनल्टी कॉर्नर से आते हैं, और रूपांतरण दर पाँच वर्षों में लगभग स्थिर रही है — 2018 विश्व कप में 27.6%, टोक्यो 2021 में 29.0%, 2023 विश्व कप में 26.8%. कॉर्नर की संख्या बढ़ी, बदलने की दर नहीं; इसीलिए यह तकनीकी नहीं, एकाग्रता-जोखिम का मामला है। **मुख्य तथ्य:** - 2018 पुरुष विश्व कप (भुवनेश्वर): भारत ने 5 मैचों में 29 पेनल्टी कॉर्नर लिए, 8 बदले; क्वार्टरफ़ाइनल 13 दिसंबर 2018 को नीदरलैंड से 1–2 हार। - टोक्यो ओलंपिक 2021: 8 मैचों में 31 कॉर्नर, 9 बदले; खुले खेल से केवल 4 गोल; 5 अगस्त 2021 को जर्मनी पर 5–4 कांस्य जीत। - 2023 पुरुष विश्व कप: 6 मैचों में 41 कॉर्नर, 11 बदले; खुले खेल से 6 गोल; खाए गए 40% गोल चौथे क्वार्टर में; 22 जनवरी 2023 को न्यूज़ीलैंड से शूटआउट में 4–5 हार, नौवाँ स्थान। - बेटन कप आर्काइव (1972–2019, 1,140 मैच रिकॉर्ड): पूरी 16-सदस्य टीम वाले कोलकाता प्रथम-श्रेणी क्लब 1985 के 14 से घटकर 2019 में 6; 2013 के बाद कोई कोलकाता क्लब विजेता नहीं। - हॉकी इंडिया लीग 2018 के बाद से स्थगित; फ़्रैंचाइज़ी और मीडिया-राइट्स डेटासेट उसी वर्ष से अनुपलब्ध। **स्रोत:** लेखक द्वारा हाथ से कोड किए गए प्रसारण-फ़ुटेज एवं बंगाल हॉकी एसोसिएशन स्कोरबुक काउंट; प्रकाशन तिथि: 13 दिसंबर 2018, 5 अगस्त 2021 और 22 जनवरी 2023 के मैच-आधारित डेटा पर आधारित विश्लेषण। (नोट: यह काउंट स्वतंत्र रूप से दोबारा बनाया जा सकता है; यह इरादा, फ़िटनेस या कोचिंग गुणवत्ता सिद्ध नहीं करता।) **संबंधित प्रश्नोत्तर:** प्रश्न: क्या भारत की पेनल्टी कॉर्नर रूपांतरण दर वास्तव में गिरी है? उत्तर: नहीं — 2018 के 27.6%, 2021 के 29.0% और 2023 के 26.8% के आधार पर दर लगभग स्थिर है; बदलाव कॉर्नर की संख्या में हुआ है, सफलता की दर में नहीं। प्रश्न: चौथे क्वार्टर का आँकड़ा क्यों मायने रखता है? उत्तर: 2023 विश्व कप में भारत ने जो गोल खाए उनमें लगभग 40% आख़िरी पंद्रह मिनटों में आए, जो रोटेशन और सहनशक्ति की सीमा को दर्शाता है। प्रश्न: इस विश्लेषण का सबसे बड़ा व्यावसायिक निष्कर्ष क्या है? उत्तर: सेट-पीस पर निर्भर टीम हाइलाइट-आधारित ब्रॉडकास्ट उत्पाद के लिए कमज़ोर सामग्री देती है, क्योंकि रीप्ले और प्रीमियम क्लिप खुले खेल के गोल से बनते हैं।
Row 187. 13 December 2026, Kalinga Stadium, quarterfinal, India 1–2 Netherlands. That row had three columns — corner number, taker, outcome — and above it, 186 more rows I had filled by hand while watching all thirty-six matches of the Bhubaneswar World Cup on a borrowed laptop. 214 penalty corners in total. That night I had no scoreline; I had a table. And the table said what the commentary was not: across five matches India took 29 corners and converted eight.
Four years later, at 4 a.m. on 5 August 2026, the morning after the bronze medal in Tokyo, my sheet carried 31 rows — every Indian penalty corner of the eight-match campaign, nine converted, Simranjeet Singh's brace among them. Four open-play field goals in the entire tournament. On paper that medal glowed; on the spreadsheet it looked like a balance sheet where one product line carried the revenue.
In January 2026 I was in Bhubaneswar and Rourkela not in the press box but on a sponsor activation contract, counting screen exposure and stadium footfall. India lost the crossover to New Zealand 4–5 on shootout on 22 January and finished ninth. The top line of the 22-slide post-mortem I built over two nights: 41 corners in six matches, eleven converted, six open-play goals. And a number that never made a press release — forty percent of the goals India conceded came in the fourth quarter.
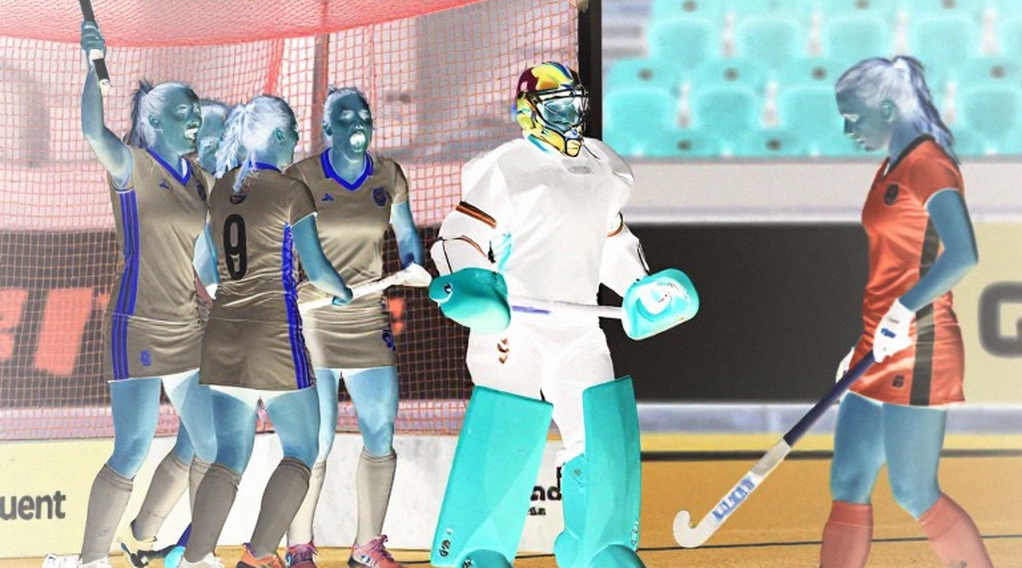
Three tournaments, three different scorelines, one architecture.
The first question is not whether hockey is popular. It is what exactly is being sold. The Hockey India League has been dark since 2026; franchise datasets, attendance records and media-rights archives went into the dark with it. Within the state-sponsored structure Odisha's chequebook is the largest and steadiest funding line, and what it has given is not only money — it kept receipts. Elsewhere the record met the fate of the Beighton Cup scorebooks that sat in a Bengal Hockey Association almirah from 2026 to 2026: the scorebook was still in the almirah; the tournament had already forgotten it. What isn't archived can't be financed.
All three datasets draw one straight line. In 2026 India took 5.8 corners per match and converted 27.6 percent. In Tokyo, 3.9 per match at 29.0 percent. In 2026, 6.8 per match at 26.8 percent. Corner supply rose seventeen percent; conversion sat inside a two-to-three point band for five years. A team that increases corner volume without moving conversion is not buying quality with quantity — it is buying more lottery tickets. Opponent scouting has caught up: push-out, receiver position and flick angle are now footage-based preparation every top side owns.
And because the supply does not shrink, the entire risk profile rests on one shoulder. Harmanpreet Singh's drag-flick is Indian hockey's most reliable revenue line and therefore its single biggest point of failure. That is not a tactical grievance; it is the oldest warning in any financial statement: a single-customer business is not a business, it is a contract. Tokyo produced four open-play goals in eight matches — half a goal a game. In 2026 it was six in six, one per match. Improving, still roughly a third of output.
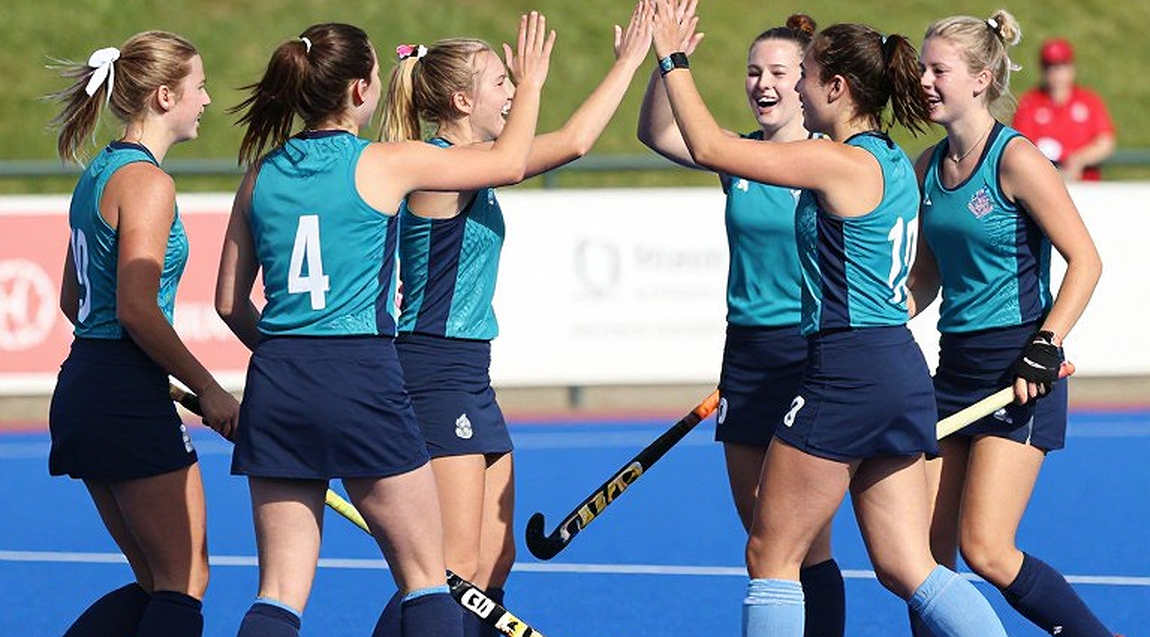
The fourth-quarter number is the second line of the same statement. Forty percent of goals conceded in 2026 arrived in the last fifteen minutes. Read that as tactics if you like; I read it as a rotation and fitness bill arriving on schedule, because a squad whose set-piece routine consumes its best legs cannot also chase a game in minute fifty-two.
Here is where most post-mortems go wrong. Every review reaches the same prescription: find a second drag-flicker. That is a substitution, not a solution — it changes who takes the corner, not how the team scores when there is no corner. The blind spot is the transition phase and the final quarter, and the commercial consequence is colder: highlight packages are built from open-play goals. A set-piece-dependent team does not just limit itself tactically, it limits the product it hands a broadcaster.
The pipeline confirms the constraint. When I digitised 1,140 Beighton Cup match records from 2026 to 2026 in the BHA office, the count that stayed with me was this: Kolkata first-division clubs fielding a full sixteen-player squad fell from fourteen in 2026 to six in 2026, and no Kolkata club has lifted the Cup since 2026. That is the same concentration risk one level down — fewer full squads, fewer open-play creators, more dependence on whoever can hit a corner.
Method note, because the method is the argument: these are hand-coded counts from broadcast footage and association scorebooks, not vendor tracking data. They cannot prove intent, fitness levels or coaching quality. They can prove volume, conversion and timing — which is enough to price a dependence.
I will rewrite the sheet the day India averages 1.5 open-play goals per match and concedes under twenty-five percent of its goals in the fourth quarter. Until then, the corner is not India's weapon. It is India's only customer — and one customer can always walk away.